Uncertain spatio-temporal data
Two uncertain spatio-temporal attributes.
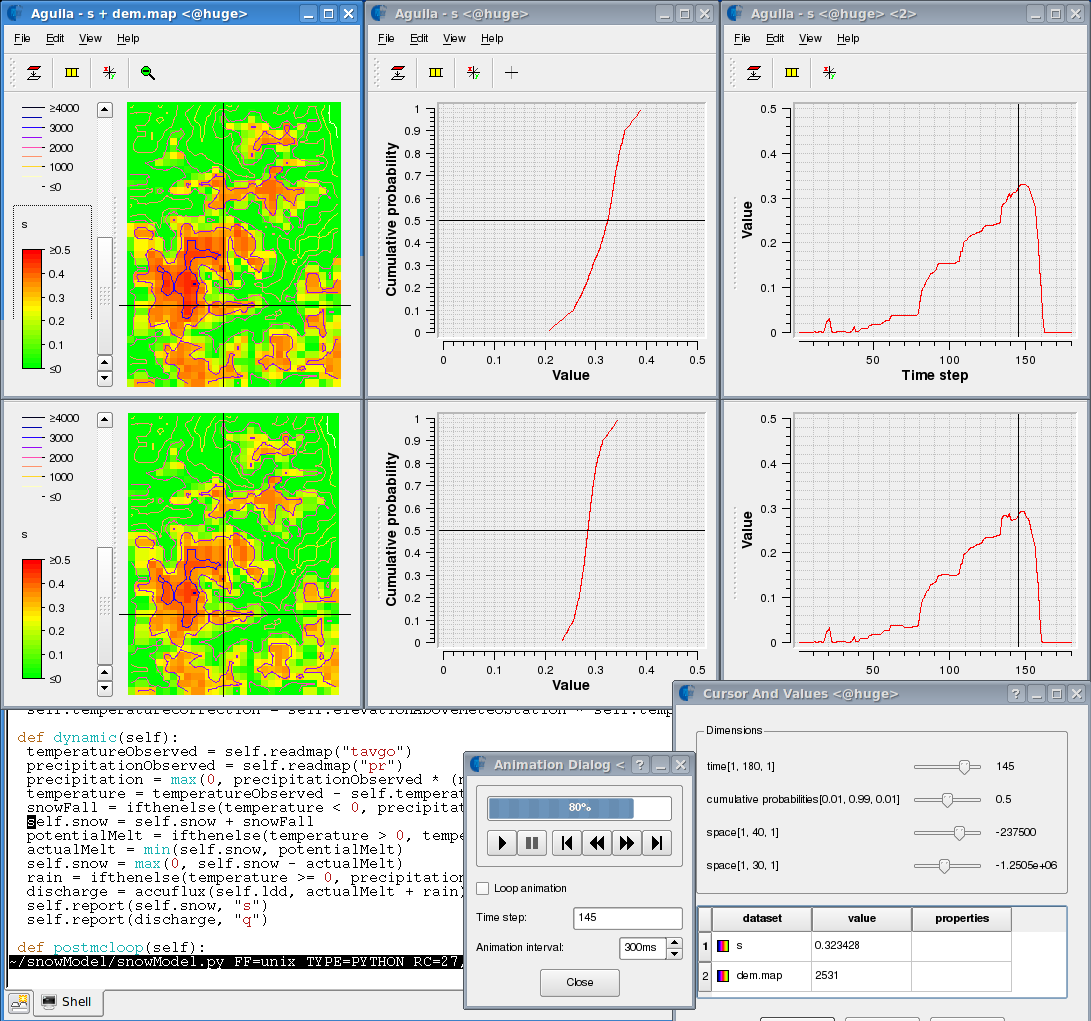
The left-most two views show maps of quantile values. The middle two views show cumulative probability graphs. The right-most two views show time series.
The three views per row shown, visualize a single uncertain spatio-temporal attribute. The maps show quantile values, given the selected quantile in the cumulative probability graph, and given the selected time step in the time series graph. Similar, both the cumulative probability graph and the time series graph show values for the selected spatial coordinate in the map view.
The selected spatial coordinate, quantile level and time step, are part of the global cursor. This cursor can be changed interactively and this triggers relevant updates of visualisations.